

49.289 BF1187
– Ragwort Root-borer – Epiblema costipunctana – (Haworth, 1811)
Adult Micro:
CAT 2
– Can be confused with other species –
 – click for General Verification Guidelines |
– click for Specific Verification Guidelines
– click for General Verification Guidelines |
– click for Specific Verification Guidelines
– click for General Verification Guidelines |
– click for Specific Verification Guidelines
 – Significant Record / Rare / Vagrant
 – easy to identify, generally distinctive and unlikely to be confused with other species.
ID pointers: The forewing is a blend of dark brown, mixed with yellowish brown or reddish brown with a basal patch spread thinly across the base. An obvious whitish dorsal blotch
Distribution:
Very few modern day records – Harrison & Sterling reported the moth as locally common. DaNES 4 records 1995,2002,2008,2012 – one iRecord Norton Lees 18/6/2022
; one 29/6/2025 from Norton Lees.
General Comment: None
*** Last updated on 17 October 2025 by TD ***
Last Recorded Year: 2025
Last Recorded By – Pete Mella
Last Recorded General Area – Norton Lees
Images of Interest
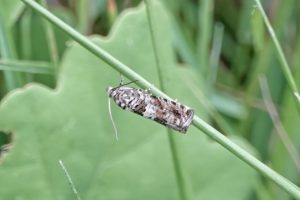

Image Gallery

Temporal Distribution Chart
Adults: (between 1995 - 2026)
(click legend below to show/hide datasets)
This chart summarises all available historical occurrence records collated by ISO week of the year. It reflects recorder effort and sampling distribution as well as true biological activity, and should be interpreted as an indicative pattern of seasonal occurrence rather than a statistically controlled abundance or phenology model.
Changes in First and Last Recorded Activity Dates Over Time
Activity Data Range:
1995 –
2026
Earliest Appearance:
1st June (in 2002)
Latest Appearance:
21st July (in 2012)
This chart presents a time-series summary of recorded observations. It is based on available records at the time of analysis and will evolve as further data are added. The rolling mean provides a smoothed representation of variation in recorded activity over time. Annual record totals are shown for context; years with fewer records may provide a less complete representation of activity than years with higher recording intensity. Interpretation should consider that apparent trends may reflect both biological change and variation in recording effort.